Dzień świstaka
February 5, 2017
← poprzednia notka |Prowadzę tego bloga już 8 lat, i nigdy nie przestaje mnie zadziwiać naiwność negacjonistów globalnego ocieplenia.
Te same osoby, które odrzucają ustalenia nauki – bo to spisek ONZ, bo klimatolodzy oszukują, bo dane sfałszowane – bez chwili zastanowienia akceptują “alternatywne fakty”, których jedynym źródłem jest śmieszny obrazek w internecie, krótki filmik z żółtymi napisami, albo sensacyjny artykuł z niemądrego tabloidu.
Miałem trochę inne plany na niedzielę, niż prostowanie głupot z brytyjskiej prasy codziennej, ale widzę że artykuł “How world leaders were duped into investing billions over manipulated global warming data” zdążył już zostać podchwycony przez niektórych dziennikarzy.

Poniżej skomentuję więc kilka głównych tez padających w artykule Davida Rose’a, który jest źródłem dla red. Wróblewskiego. Nie odnoszę się do każdego akapitu (i tak zajęło mi to już zbyt dużo czasu), jeśli więc macie jakieś dodatkowe pytania albo uważacie że trzeba coś jeszcze wyjaśnić, piszcie w komentarzach, na maila albo twitterze.
Ok, no to jedziemy.
The Mail on Sunday today reveals astonishing evidence that the organisation that is the world’s leading source of climate data rushed to publish a landmark paper that exaggerated global warming and was timed to influence the historic Paris Agreement on climate change.
A high-level whistleblower has told this newspaper that America’s National Oceanic and Atmospheric Administration (NOAA) breached its own rules on scientific integrity when it published the sensational but flawed report, aimed at making the maximum possible impact on world leaders including Barack Obama and David Cameron at the UN climate conference in Paris in 2015.
Artykuł Karla i in. [1] został wysłany do Science na rok przed konferencją COP21 w Paryżu, i choć możliwe że nie mam wystarczająco bujnej wyobraźni, trudno mi uwierzyć, iż robienie wrażenia na Obamie i Cameronie było główną motywacją naukowców z NOAA. W rzeczywistości, chronologia tego konkretnego projektu ma proste uzasadnienie: w 2014 roku oficjalnie opublikowana została nowa wersja analizy temperatur oceanów ERSST [2], oraz pierwsza wersja nowej bazy danych ISTI [3], zawierających wyniki pomiarów z lądowych stacji meteorologicznych.
Obie inicjatywy naukowe (zainicjowane kilka lat wcześniej) pozostały przez negacjonistów klimatycznych niezauważone, i dopiero kiedy Tom Karl z kolegami udzielił odpowiedzi na (dość oczywiste) pytanie: “co się stanie jeśli połączymy jedne dane z drugimi”, negacjoniści klimatyczni zaczęli krzyczeć o rzekomym oszustwie. Z powodów ideologicznych nie spodobała im się bowiem uzyskana odpowiedź: “trend temperatur globalnych w latach 1998-2012 będzie wyższy niż we wcześniejszej analizie”.
Wiarygodności kuriozalnym oskarżeniom Daily Mail ma przydawać emerytowany naukowiec z NOAA, John Bates:
But the whistleblower, Dr John Bates, a top NOAA scientist with an impeccable reputation, has shown The Mail on Sunday irrefutable evidence that the paper was based on misleading, ‘unverified’ data.
It was never subjected to NOAA’s rigorous internal evaluation process – which Dr Bates devised.
His vehement objections to the publication of the faulty data were overridden by his NOAA superiors in what he describes as a ‘blatant attempt to intensify the impact’ of what became known as the Pausebuster paper.
Dłuższą wersję tej historii, opowiedzianą przez Batesa, można przeczytać na blogu Judith Curry. Do głównych tez Batesa odniosę się szczegółowo poniżej, na razie odnotuję tylko, że na blogu Curry jedynym udokumentowanym zarzutem Batesa jest to, iż dane towarzyszące artykułowi Karla nie zostały zarchiwizowane dokładnie według biurokratycznego standardu, który wymyślił i wdrożył w NOAA sam Bates 11 A nie zostały zarchiwizowane według tego standardu, bo analiza Karla i jego kolegów nie była “produktem” w takim sensie, w jakim są inne analizy publikowane przez NOAA, i których publikacja niesie ze sobą określone zobowiązania prawne ze strony instytucji udostępniającej dane.. W artykule Daily Mail padają już cięższe oskarżenia – że dane analizowano w niepoprawny sposób, albo wręcz, tak jak twierdzi red. Wróblewski, że “klimatolodzy fałszowali dane”.
Jest to, oczywiście, kłamstwo.
NOAA’s 2015 ‘Pausebuster’ paper was based on two new temperature sets of data – one containing measurements of temperatures at the planet’s surface on land, the other at the surface of the seas.
Both datasets were flawed. This newspaper has learnt that NOAA has now decided that the sea dataset will have to be replaced and substantially revised just 18 months after it was issued, because it used unreliable methods which overstated the speed of warming. The revised data will show both lower temperatures and a slower rate in the recent warming trend.
To zwykła manipulacja autora Daily Mail. Prace nad wersją czwartą analizy ERSST trwały do końca 2013 roku, nie jest więc niczym dziwnym, że odpowiedzialni za nią naukowcy w ciągu ostatnich 3 lat zaczęli prace nad kolejnymi jej ulepszeniami (poprzednie iteracje opublikowane zostały w 2003, 2004 i 2008 roku), uwzględniając między innymi nowe źródła danych (np. boje ARGO). Według wstępnych szacunków, w wersji 5 trend 2000-2015 będzie około 10% niższy niż w wersji 4 (użytej przez Karla i in.), ale wciąż o 50% wyższy niż w wersji 3 (która według Daily Mail i Batesa jest “poprawna”).
Oczywiście, nieopublikowana jeszcze wersja piąta ERSST też nie będzie ostatnim słowem klimatologów w temacie pomiarów ocieplenia oceanów, i możliwe że w kolejnych wersjach trend temperatur w tym samym okresie może być nieco wyższy albo niższy. Daily Mail najwyraźniej nie rozumie, że ulepszanie metod statystycznych i uwzględnianie nowych danych to kwintesencja nauki, a nie dowód oszustwa.
The land temperature dataset used by the study was afflicted by devastating bugs in its software that rendered its findings ‘unstable’.
The paper relied on a preliminary, ‘alpha’ version of the data which was never approved or verified.
A final, approved version has still not been issued. None of the data on which the paper was based was properly ‘archived’ – a mandatory requirement meant to ensure that raw data and the software used to process it is accessible to other scientists, so they can verify NOAA results.
Trudno zrozumieć, co autor Daily Mail tutaj ma na myśli. Zarówno baza danych ISTI, jak i algorytm homogenizacji użyty przez Karla i in. zostały opublikowane, a bugi w oprogramowaniu wraz z wpływem (znikomym, swoją drogą) jaki miały na wyniki zostały udokumentowane. Daily Mail wraz z Batesem oskarża klimatologów, że dane nie zostały “właściwie” zarchiwizowane, co uniemożliwia innym naukowcom zweryfikowanie wyników NOAA. Tymczasem dane towarzyszące publikacji Karla i in. są od momentu publikacji dostępne na serwerze NOAA, a innym naukowcom udało się z powodzeniem je zweryfikować [4].
W dalszej części artykułu Daily Mail powtarza już dosłownie techniczne zarzuty Batesa (choć ponownie warto zauważyć, że nie pojawiają się one na blogu Curry).
The sea dataset used by Thomas Karl and his colleagues – known as Extended Reconstructed Sea Surface Temperatures version 4, or ERSSTv4, tripled the warming trend over the sea during the years 2000 to 2014 from just 0.036C per decade – as stated in version 3 – to 0.099C per decade. Individual measurements in some parts of the globe had increased by about 0.1C and this resulted in the dramatic increase of the overall global trend published by the Pausebuster paper. But Dr Bates said this increase in temperatures was achieved by dubious means. Its key error was an upwards ‘adjustment’ of readings from fixed and floating buoys, which are generally reliable, to bring them into line with readings from a much more doubtful source – water taken in by ships. This, Dr Bates explained, has long been known to be questionable: ships are themselves sources of heat, readings will vary from ship to ship, and the depth of water intake will vary according to how heavily a ship is laden – so affecting temperature readings.
Dr Bates said: ‘They had good data from buoys. And they threw it out and “corrected” it by using the bad data from ships. You never change good data to agree with bad, but that’s what they did – so as to make it look as if the sea was warmer.’
ERSSTv4 ‘adjusted’ buoy readings up by 0.12C. It also ignored data from satellites that measure the temperature of the lower atmosphere, which are also considered reliable. Dr Bates said he gave the paper’s co-authors ‘a hard time’ about this, ‘and they never really justified what they were doing.’
Fragment ten świadczy o kompletnym niezrozumieniu procesu homogenizacji zastosowanym przez autorów analizy ERSST, i jeśli Bates zgłaszał te zastrzeżenia kolegom, nie dziwię się że go grzecznie zignorowali.
Po pierwsze, jest prawdą że średnia temperatura wody zmierzona przez statki jest o około 0,1°C wyższa niż temperatura mierzona przez dryfujące boje. W ciągu ostatnich 30 lat udział pomiarów wykonywanych przez boje zwiększył się z 10% do 90% (a udział statków zmniejszył się z 90% do 10%), więc konsekwencją tego procesu jest sztuczne “ochłodzenie” widziane w szeregach czasowych temperatury. A ponieważ klimatologów interesują zmiany klimatu, a nie zmiany liczby statków pływających po oceanach, takie błędy systematyczne powinny być korygowane.
Naukowcy z NOAA wiedzieli o tym fakcie od dawna. Przykładowo, 10 lat temu, w artykule [5] dokumentującym trzecią wersję analizy ERSST pisali:
In addition to biases in satellite data, there are other data biases. The most important additional data bias may be the ship–buoy bias (Kent and Taylor 2006; Rayner et al. 2006). This relative bias is important because of the growing number of buoy SSTs since the mid-1980s (e.g., Reynolds et al. 2002). Before 1985 most in situ SSTs are ship measurements. Where both ship and buoy observations are available, the ships are typically about 0.1°C warmer. However, the bias is not constant in either space or time where both data types are available. In addition, before the mid-1980s there are few buoy observations so directly analyzing the bias from data over the full reconstruction period is not possible.
W wersji trzeciej nie udało się zatem jeszcze tej korekty wprowadzić, i uczyniono to dopiero w wersji czwartej, doprowadzając do wzrostu trendu temperatur, który tak oburza negacjonistów globalnego ocieplenia.
Po drugie, łatwo jest zrozumieć, że dla wartości trendu nie ma znaczenia czy poprawka zbliża “złe” dane do “dobrych”, czy “dobre” do “złych”. Analiza ERSST dotyczy bowiem zmian temperatury oceanów w czasie, a wartość trendu nie zależy od wartości stałej, którą do niego dodamy. Z powodów praktycznych (pomiary dokonywane przez boje są bardziej homogeniczne, więc poprawkę łatwiej jest zastosować) wybrano ten drugi wariant, ale gdyby zdecydowano się na poprawkę w odwrotnym kierunku, wynik byłby taki sam.
Po trzecie, nieprawdą jest, że “dobre” dane mierzone przez boje wyrzucono. Wręcz przeciwnie, metodologia konstrukcji analizy ERSST daje większą wagę obserwacjom obciążonym mniejszym błędem.
Po czwarte, analiza ERSST “ignoruje” satelitarne pomiary temperatury troposfery, bo nie jest analizą temperatury troposfery, tylko powierzchni oceanów. Być może chodzi o to, że ERSST nie używa pomiarów z radiometrów AVHRR – jednak były ku temu bardzo dobre powody [6].
Now, some of those same authors have produced the pending, revised new version of the sea dataset – ERSSTv5. A draft of a document that explains the methods used to generate version 5, and which has been seen by this newspaper, indicates the new version will reverse the flaws in version 4, changing the buoy adjustments and including some satellite data and measurements from a special high-tech floating buoy network known as Argo. As a result, it is certain to show reductions in both absolute temperatures and recent global warming.
Znajduję wysoce ironicznym to, że Daily Mail krytykuje Karla za używanie rzekomo “niezweryfikowanych” danych ISTI, i jednocześnie powołuje się na nieukończoną jeszcze, piątą wersję analizy ERSST. Jak jednak napisałem wyżej, nie jest niczym dziwnym że będzie ona trochę różnić się metodologią, źródłami danych (jaki byłby sens przygotowania nowej wersji, gdyby było inaczej!), a zatem i wyniki mogą być nieco inne.
The second dataset used by the Pausebuster paper was a new version of NOAA’s land records, known as the Global Historical Climatology Network (GHCN), an analysis over time of temperature readings from about 4,000 weather stations spread across the globe.
This new version found past temperatures had been cooler than previously thought, and recent ones higher – so that the warming trend looked steeper. For the period 2000 to 2014, the paper increased the rate of warming on land from 0.15C to 0.164C per decade.
In the weeks after the Pausebuster paper was published, Dr Bates conducted a one-man investigation into this. His findings were extraordinary. Not only had Mr Karl and his colleagues failed to follow any of the formal procedures required to approve and archive their data, they had used a ‘highly experimental early run’ of a programme that tried to combine two previously separate sets of records.
This had undergone the critical process known as ‘pairwise homogeneity adjustment’, a method of spotting ‘rogue’ readings from individual weather stations by comparing them with others nearby.
However, this process requires extensive, careful checking which was only just beginning, so that the data was not ready for operational use. Now, more than two years after the Pausebuster paper was submitted to Science, the new version of GHCN is still undergoing testing.
Przyznam, że nie rozumiem na czym polega zbrodnia klimatologów. Że użyli najnowszej bazy danych pomiarów temperatur, a nie wersji GHCN sprzed kilku lat, co prawda zawierającej 4 razy mniej stacji meteorologicznych, ale poprawnie zarchiwizowanej i formalnie zaakceptowanej przez biurokratów z NOAA? Że nie stworzyli produktu “gotowego do operacyjnego użytku”? Oczywiście, że nie stworzyli, przecież pisali artykuł do Science.
Moreover, the GHCN software was afflicted by serious bugs. They caused it to become so ‘unstable’ that every time the raw temperature readings were run through the computer, it gave different results. The new, bug-free version of GHCN has still not been approved and issued. It is, Dr Bates said, ‘significantly different’ from that used by Mr Karl and his co-authors.
“Bug-free version” jakiegokolwiek złożonego oprogramowania nie istnieje, i zapewniam czytelników że w nowej (czwartej) wersji GHCN też znajdą się błędy. Rzekoma niereplikowalność wyników, o której pisze Bates, wynika natomiast z czego innego - każda duża baza danych taka jak GHCN czy ISTI jest często aktualizowana, a nowe wartości mogą zmienić kryteria oceny, które są używane przez algorytm homogenizacji do wykrywania błędów systematycznych.
Dr Bates revealed that the failure to archive and make available fully documented data not only violated NOAA rules, but also those set down by Science. Before he retired last year, he continued to raise the issue internally.
To bardzo dziwny zarzut. Według oficjalnych instrukcji tygodnika Science, dane klimatyczne towarzyszące artykułom w nim publikowanym powinne być “zarchiwizowane w repozytorium klimatycznym NOAA albo innej publicznej bazie danych” (wyróżnienie moje). Karl i koledzy dane zarchiwizowali w postaci plików tekstowych na serwerze FTP, co redaktorom Science wystarczyło,22 Dzisiaj (6 lutego) Jeremy Berg, redaktor naczelny Science, potwierdził, że wbrew twierdzeniom Batesa i Daily Mail, dane towarzyszące artykułowi Karla i in. zostały zarchwizowane w sposób zgodny z regułami wyznaczonymi przez tygodnik. Zaprzeczył jednocześnie, by proces recenzencki tego artykułu był w jakiś sposób przyspieszony – wręcz przeciwnie, trwał nawet dłużej (niemal 6 miesięcy) niż przeciętnie. Z korespondencji pomiędzy Jeremy Bergiem a Davidem Rose wynika, że dziennikarz Daily Mail wiedział przed publikacją artykułu, iż zasady archiwizacji danych tygodnika Science nie zostały złamane, jednak nie powstrzymało go to przed napisaniem nieprawdy. i wiele osób (ze mną włącznie) nie miało najmniejszych problemów z dostępem i przetwarzaniem tych danych. To, że nie spełniały wyśrubowanych standardów wdrażanych przez Batesa w NOAA w niczym nam nie przeszkadzało.
Then came the final bombshell. Dr Bates said: ‘I learned that the computer used to process the software had suffered a complete failure.’ The reason for the failure is unknown, but it means the Pausebuster paper can never be replicated or verified by other scientists.
Powtórzę - to kłamstwo. Jak pokazali Hausfather i in. [4], analiza klimatologów z NOAA zgadza się z wynikami uzyskanymi na podstawie niezależnych pomiarów (m. in. pływaków Argo i satelitów):
We show that ERSST version 4 trends generally agree with largely independent, near-global, and instrumentally homogeneous SST measurements from floating buoys, Argo floats, and radiometer-based satellite measurements that have been developed and deployed during the past two decades. We find a large cooling bias in ERSST version 3b and smaller but significant cooling biases in HadSST3 and COBE-SST from 2003 to the present, with respect to most series examined. These results suggest that reported rates of SST warming in recent years have been underestimated in these three data sets.
Porównanie nowej (ERSSTv4 – kolor szary) i starej (ERSSTv3b – linia przerywana) wersji analizy temperatur oceanów NOAA, oraz niezależnych pomiarów satelitarnych Europejskiej Agencji Kosmicznej (CCI – niebieski) i serii temperatur stworzonej wyłącznie z danych zmierzonych przez boje oceanograficzne (czerwony). Źródło: [4].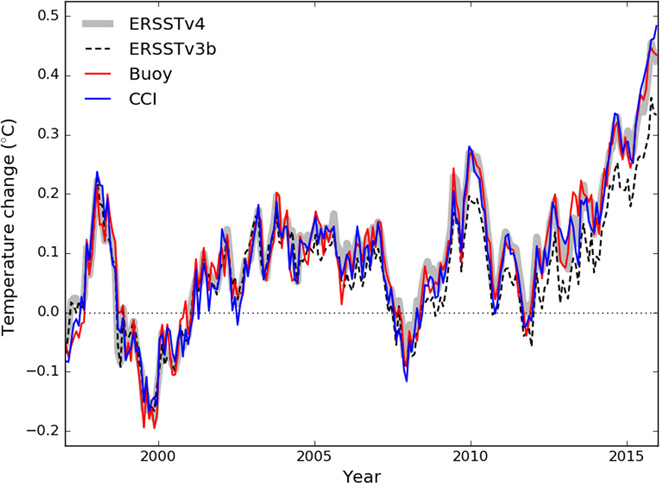
Dodam, że ten rodzaj weryfikacji wyników jakiegoś badania jest pod względem naukowym bardziej przydatny, niż zapuszczenie tego samego programu na tych samych danych. W tym ostatnim przypadku demonstrujemy co najwyżej, że udało nam się odtworzyć środowisko obliczeniowe w którym uzyskano jakiś wynik, i nic nam to nie mówi o jego poprawności.
I na koniec, o tym, że dziennikarz Daily Mail nie ma pojęcia o temacie, najlepiej świadczy poniższy wykres
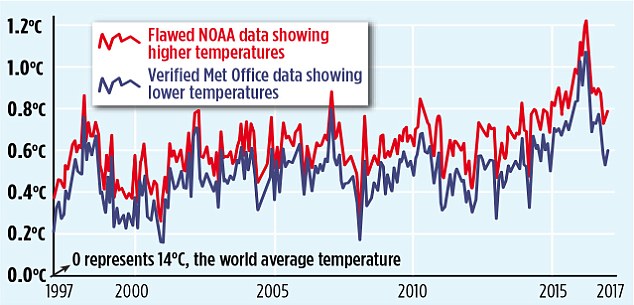
podpisany
The misleading ‘pausebuster chart’: The red line shows the current NOAA world temperature graph – which relies on the ‘adjusted’ and unreliable sea data cited in the flawed ‘Pausebuster’ paper. The blue line is the UK Met Office’s independently tested and verified ‘HadCRUT4’ record – showing lower monthly readings and a shallower recent warming trend.
W rzeczywistości pozycja “zera” na tym wykresie jest dość arbitralna (średnia globalna temperatura oceanów jest znana ze znacznie mniejszą dokładnością, niż jej zmiany), a to że linia czerwona jest nad linią niebieską jest efektem tego, że dziennikarz Daily Mail narysował anomalie używające różnych okresów bazowych: 1961-1990 w przypadku Met Office, 1901-2000 w przypadku NOAA. Ponieważ ten drugi okres (obejmujący cały XX wiek) był nieco chłodniejszy niż pierwszy (obejmujący tylko trzy dekady z drugiej połowy XX wieku), anomalie temperatur liczone względem tego okresu też będą wyższe. Nie ma to oczywiście nic wspólnego z wyborami metodologicznymi dokonanymi przez naukowców odpowiedzialnych za analizę ERSST.
Jeśli narysujemy obe krzywe tak, by odnosiły się do wspólnego okresu referencyjnego (1961-1990), zobaczymy że jest pomiędzy nimi bardzo duża zgodność.
Jest prawdą, że trend odpowiadający linii niebieskiej (NOAA) jest nieco22 0,16°C i 0,13°C stopnia na dekadę w pokazanym okresie, czyli różnica wynosi tylko 13%. wyższy niż trend linii czarnej (HadCRUT4), ale jak już wspomniałem wyżej, są bardzo dobre powody by uważać, że to ta pierwsza analiza jest bliżej prawdy. Nawiasem mówiąc, klimatolodzy z Met Office, którzy odpowiadają za analizę HadCRUT4, też tak uważają.
Dodatkowy kontekst
W ciągu ostatnich 24 godzin ukazało się kilka dobrych artykułów debunkujących oskarżenia Daily Mail. Chciałbym zwrócić szczególną uwagę na dwa z nich: bloga Petera Thorne’a, jednego z głównych naukowców projektu ISTI, oraz artykuł opublikowany w serwisie Ars Technica.
Według Petera Thorna, meteorolog będący głównym źródłem cytowanym w Daily Mail nie uczestniczył na żadnym etapie w przygotowywaniu analizy ERSST, co może wyjaśniać błędy i przekłamania pojawiające się w jego wypowiedziach:
The ‘whistle blower’ is John Bates who was not involved in any aspect of the work. NOAA’s process is very stove-piped such that beyond seminars there is little dissemination of information across groups. John Bates never participated in any of the numerous technical meetings on the land or marine data I have participated in at NOAA NCEI either in person or remotely. This shows in his reputed (I am taking the journalist at their word that these are directly attributable quotes) mis-representation of the processes that actually occured. In some cases these mis-representations are publically verifiable.
Według artykułu Ars Technica, Bates próbował wdrażać w całej NOAA te same procedury, które stosowane były przy tworzeniu oprogramowania dla satelitów, co spotkało się z oporem jego kolegów:
Ars talked with Thomas Peterson, a co-author on the Karl paper who has since retired. Peterson provided some useful context for understanding Bates’ allegations. The satellites that Bates worked with were expensive hardware that couldn’t be fixed if anything went wrong after they were launched. The engineering of the software running those satellites sensibly involved testing and re-testing and re-testing again to ensure no surprises would pop up once it was too late.
Bates expected the same approach from his surface temperature counterparts, but Peterson explained that their work with weather station data was not nearly so high-stakes—problems could easily be fixed on the fly. The engineering-style process NOAA was using for endlessly double-checking the software for all dataset updates could drag on for quite a long time—years, in fact—and Bates opposed any attempt to speed this up. Peterson and other scientists were naturally anxious to incorporate changes they knew were scientifically important.
Bates alleges that the Karl paper was “rushed” for political reasons, but Peterson said the reality was that NOAA was well behind the times, waiting to include known improvements like additional recording stations in the rapidly warming Arctic. “I had been arguing for years that we were putting out data that did not reflect our understanding of how the temperature was actually warming—[for] literally years we slowed down to try to account for some of these processing things that we had to do,” Peterson said. (At the time of the Karl paper, NOAA’s dataset showed less warming in recent years than other datasets, like NASA’s.)
Bates also claims that there were bugs in the land station database software that were ignored in the Karl paper. But according to Peterson, the slight day-to-day variability seen in the software’s output was simply the result of the fact that new data was added every day. Stations that straddled statistical cut-offs might fall on one side of the dividing line today, and on the other side tomorrow. There was nothing wrong with the software, they realized. It was just silly to re-run it every single day.
Dodatkowo, 5 lat temu Karl zdegradował Batesa, usuwając go z kierowniczego stanowiska w NOAA.
There may also be something beyond simple “engineers vs. scientists” tension behind Bates’ decision to go public with his allegations. Two former NOAA staffers confirmed to Ars that Tom Karl essentially demoted John Bates in 2012, when Karl was Director of NOAA’s National Centers for Environmental Information. Bates had held the title of Supervisory Meteorologist and Chief of the Remote Sensing Applications Division, but Karl removed him from that position partly due to a failure to maintain professionalism with colleagues, assigning him to a position in which he would no longer supervise other staff. It was apparently no secret that the demotion did not sit well with Bates.
Co może wyjaśniać, dlaczego ostatnią rzeczą, którą zrobił Bates przed odejściem na emeryturę, było nasłanie na Karla donosu do republikańskich polityków. Kiedy nie przyniosło to spodziewanych skutków, poszedł do brytyjskiego brukowca.
Przypisy
1. Karl, et al (2016): Possible artifacts of data biases in the recent global surface warming hiatus. 2. Huang, et al (2014): Extended Reconstructed Sea Surface Temperature Version 4 (ERSST.v4). Part I: Upgrades and Intercomparisons. 3. Rennie, et al (2014): The international surface temperature initiative global land surface databank: monthly temperature data release description and methods 4. Hausfather, et al (2017): Assessing recent warming using instrumentally homogeneous sea surface temperature records 5. Smith, et al (2008): Improvements to NOAA’s Historical Merged Land–Ocean Surface Temperature Analysis (1880–2006) 6. Huang, et al (2016): Bias Adjustment of AVHRR SST and Its Impacts on Two SST Analyses